Datavisualization - Exam project (2022)
Background
This project was part of my final year in high school (utvikling). The assignment involved creating a data visualization tool designed to present data in a clear and meaningful way.
How It Works
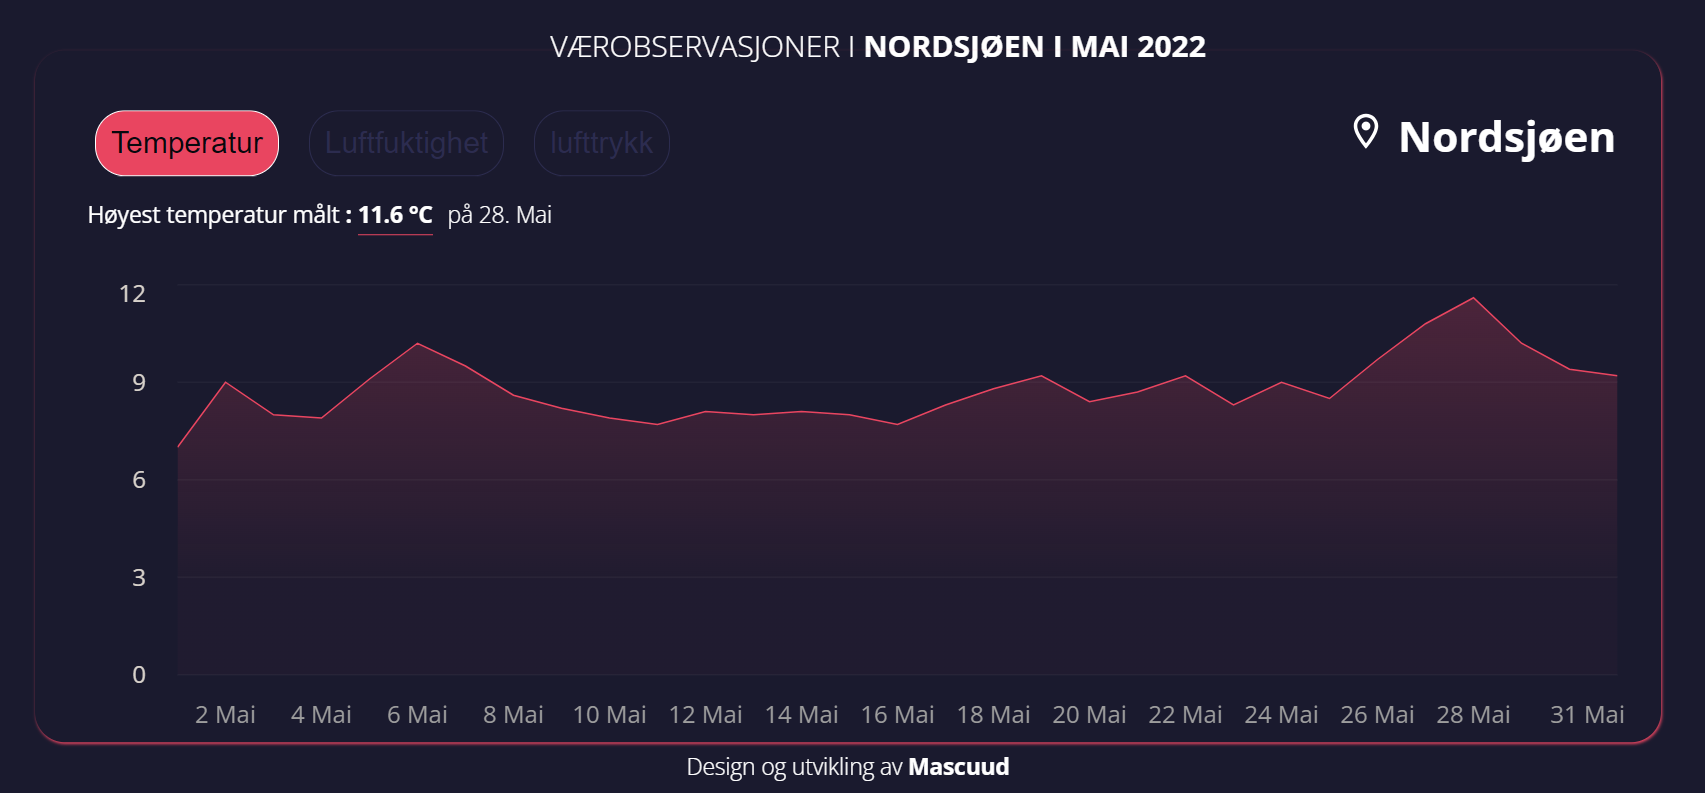
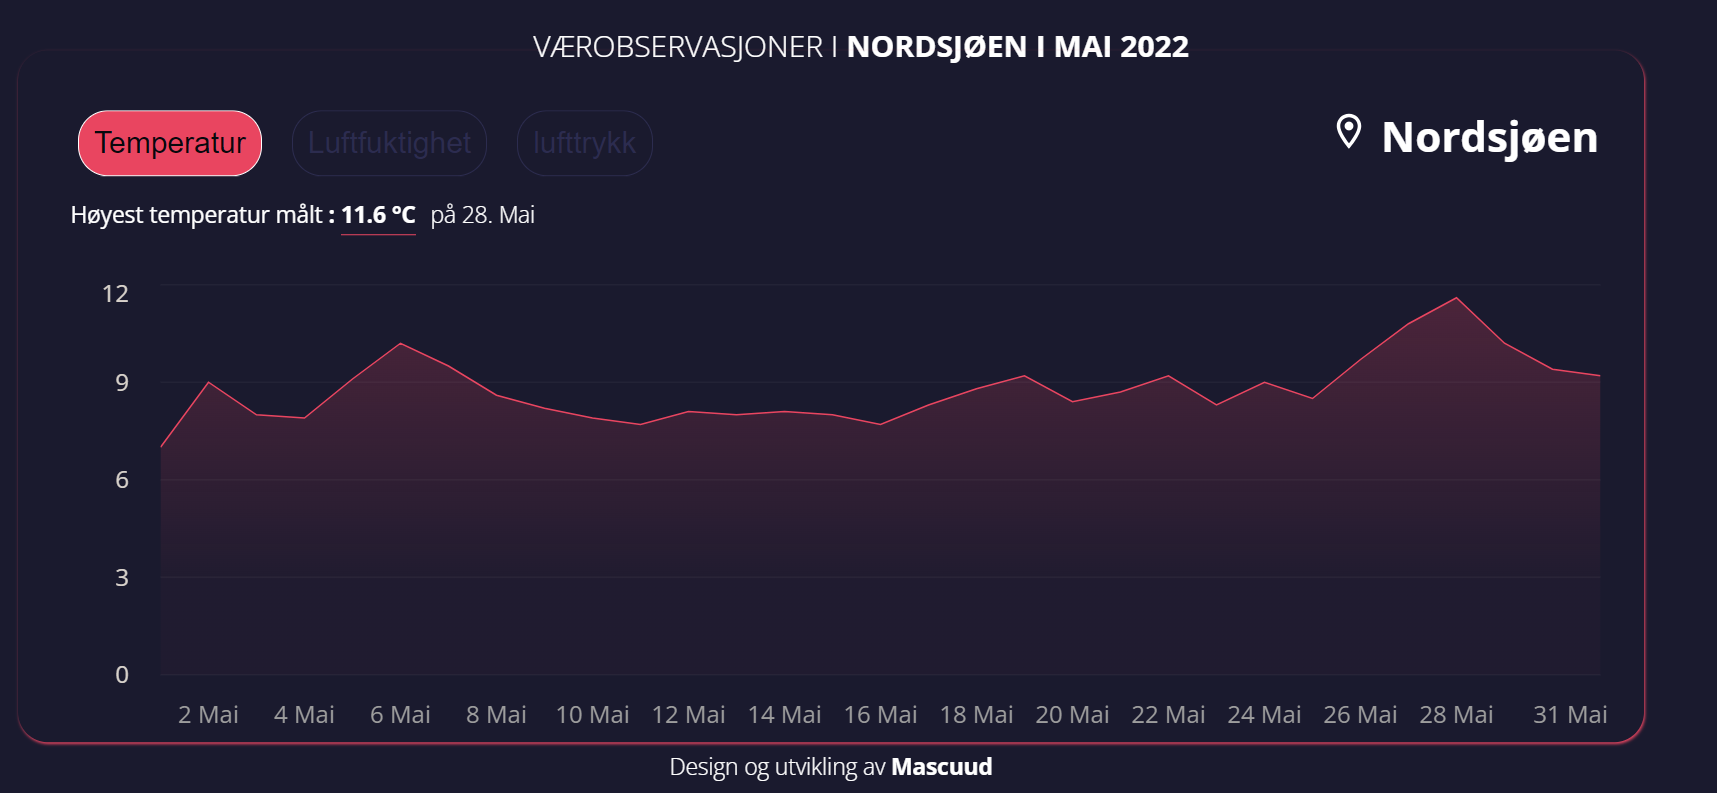
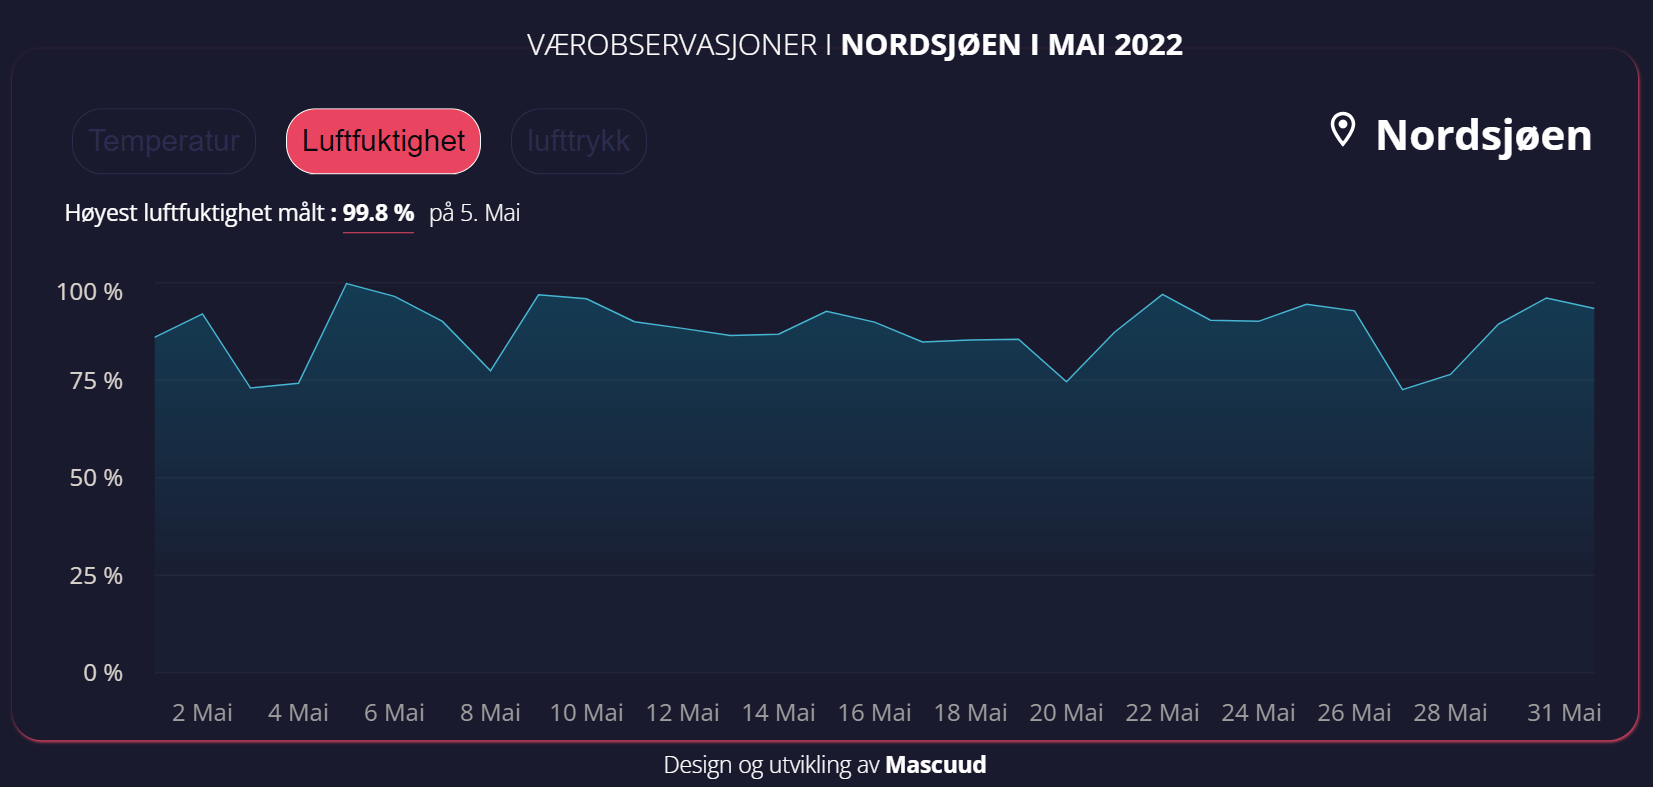
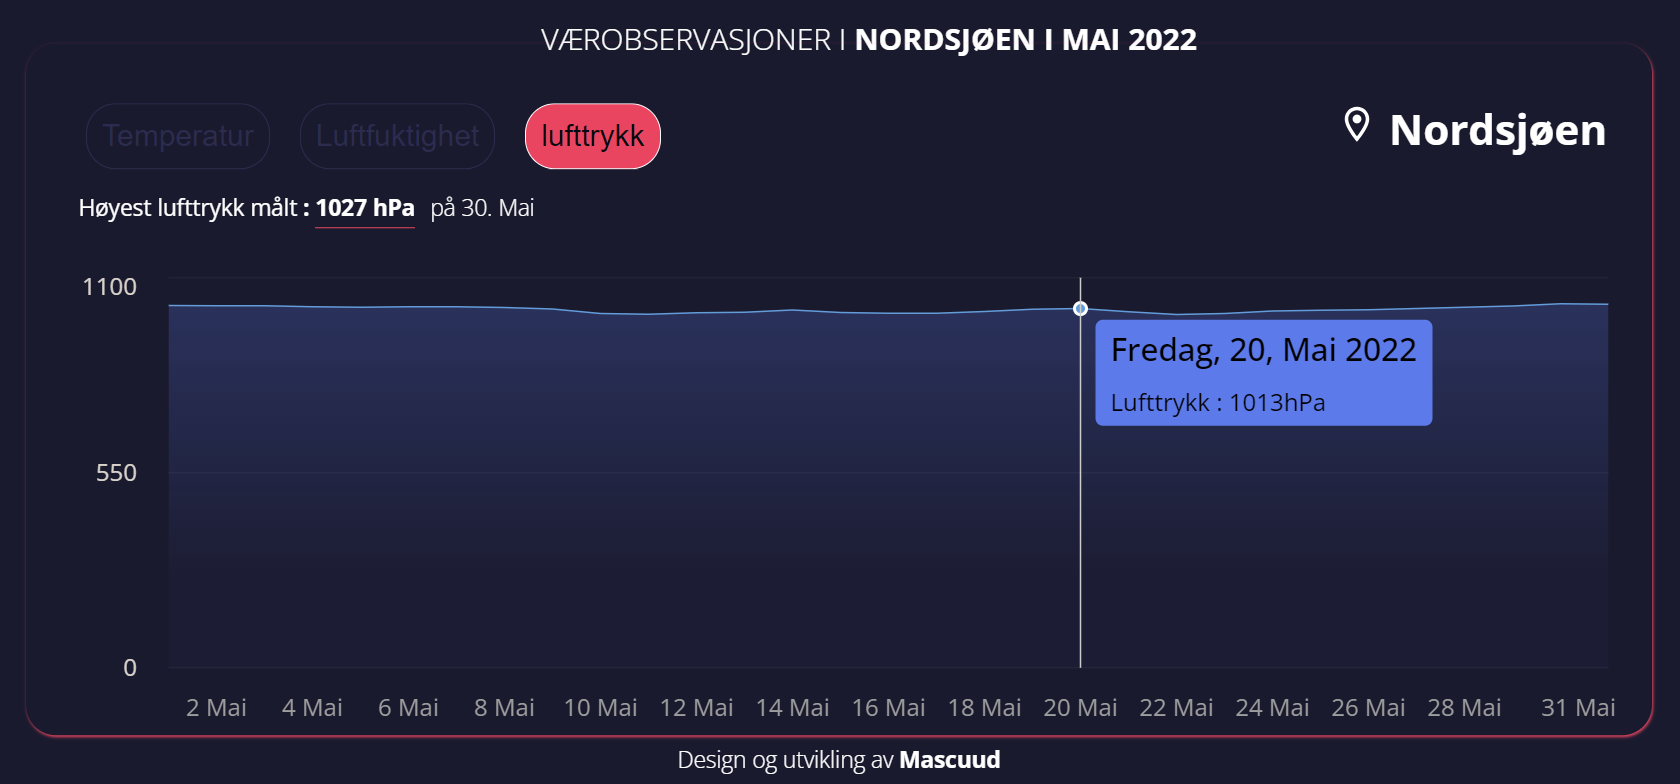
The teacher provided a dataset containing weather information for May 2022 in the North Sea.
Technologies Used
I used React and Chart.js to create the diagrams.